How to visualize Cloudflare D1 data in Grafana with the Infinity plugin
Cloudflare D1 is great when you build on Cloudflare, but at some point your database becomes more than just application state.
For GitNotifier, I wanted to answer simple product questions from Grafana:
- how many users are in the database?
- how many slack workspaces were added this week?
- are usage patterns changing over time?
I did not want to build a custom exporter, move the data somewhere else, or maintain a small backend just for dashboards.
So I used Grafana’s Infinity datasource to query the Cloudflare D1 HTTP API directly.
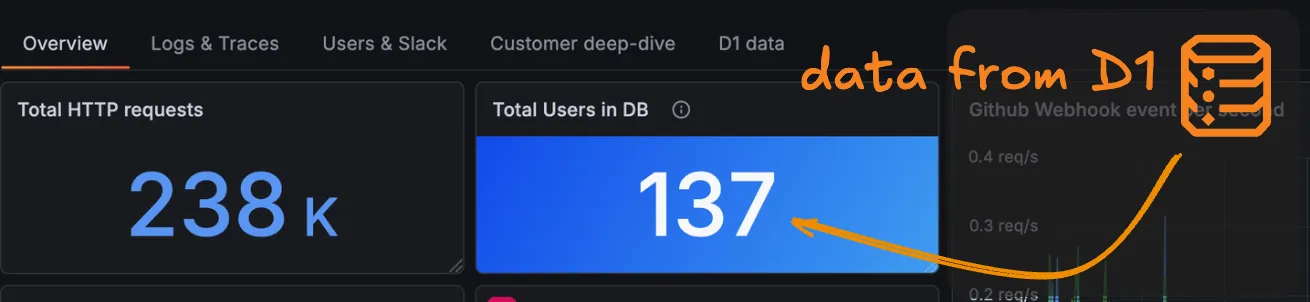
The result is simple: D1 data in a Grafana dashboard, using only HTTP, JSON parsing, and SQL queries.
Infinity can query HTTP endpoints returning JSON, CSV, XML, HTML, and even GraphQL responses. That makes it a practical way to pull data from the Cloudflare D1 API into Grafana without building dedicated dashboard infrastructure.
Here is how to set it up.
Install the Infinity datasource#
In Grafana, go to Connections and install the Infinity plugin.
Once installed, open Explore, select the Infinity data source, and choose the JSON query type. This is the mode we want for Cloudflare’s HTTP API.
If you want to play with the datasource before configuring your own instance, Grafana has a nice public demo here:
https://play.grafana.org/d/infinity-json/json-with-infinity?orgId=1&from=now-24h&to=now&timezone=utc
Create a Cloudflare API token with D1 read permissions#
You will need:
- a Cloudflare API token with D1 read permissions
- your Cloudflare account ID
- your D1 database ID
You can find the database ID from the D1 databases page in the Cloudflare dashboard, or directly from the URL when opening a database.
If you want to quickly verify your token, you can call Cloudflare’s token verification endpoint:
curl -X GET "https://api.cloudflare.com/client/v4/accounts/<ACCOUNT_ID>/tokens/verify" \
  -H "Authorization: Bearer <CLOUDFLARE_API_TOKEN>" \
  -H "Content-Type: application/json"
Two details matter here:
- use the
Authorizationheader - prefix the token with
Bearer
Query the D1 API from Grafana#
Cloudflare exposes a D1 SQL query endpoint here:
https://developers.cloudflare.com/api/resources/d1/subresources/database/methods/query
Use the following settings in Infinity:
- Method:
POST - URL:
https://api.cloudflare.com/client/v4/accounts/$ACCOUNT_ID/d1/database/$DATABASE_ID/query - Header:
Content-Type: application/json - Header:
Authorization: Bearer <your token>
The request body accepts SQL plus optional query parameters. Cloudflare’s documented example looks like this:
{
  "sql": "SELECT * FROM myTable WHERE field = ? OR field = ?;",
  "params": ["firstParam", "secondParam"]
}
To start small, try a simple query first:
{
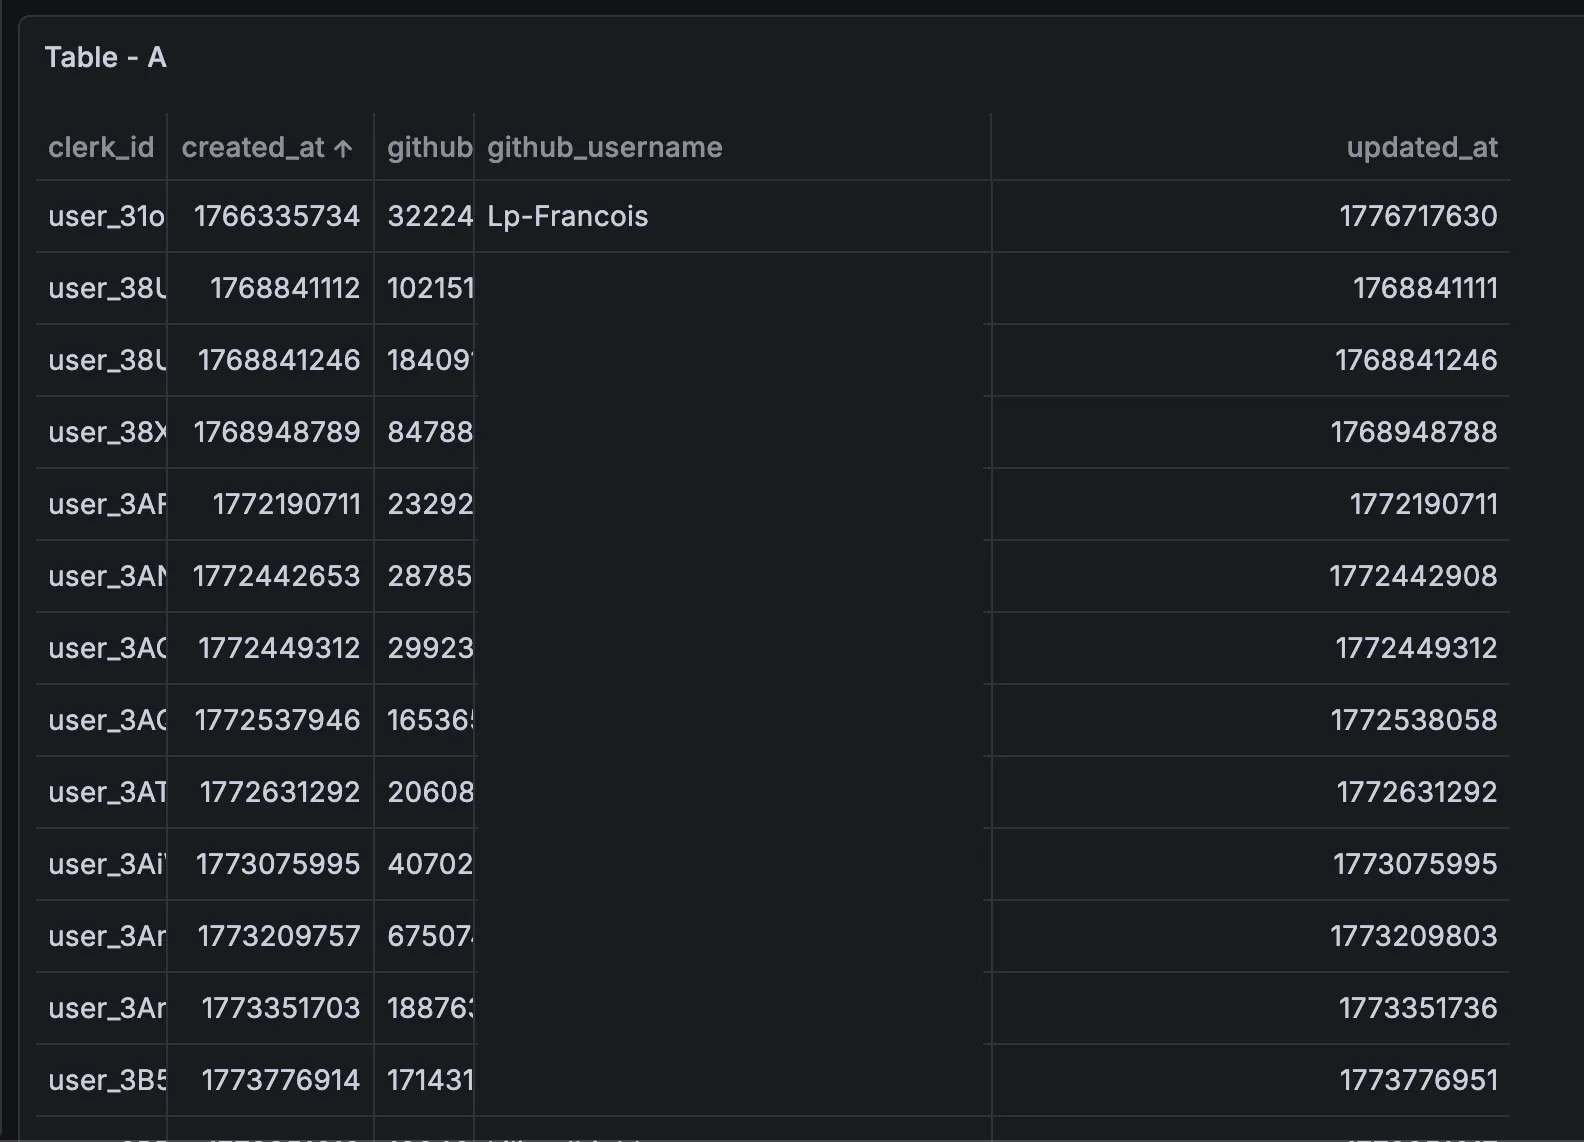
"sql": "SELECT * FROM users"
}If everything is wired correctly, the response should look roughly like this:
{
  "errors": [],
  "messages": [],
  "result": {
    "results": [
      {
        "id": 1,
        "name": "Ada"
      }
    ]
  }
}
The interesting data is nested in the response payload, so you will usually want to parse it before visualizing it.
Extract only the rows you need#
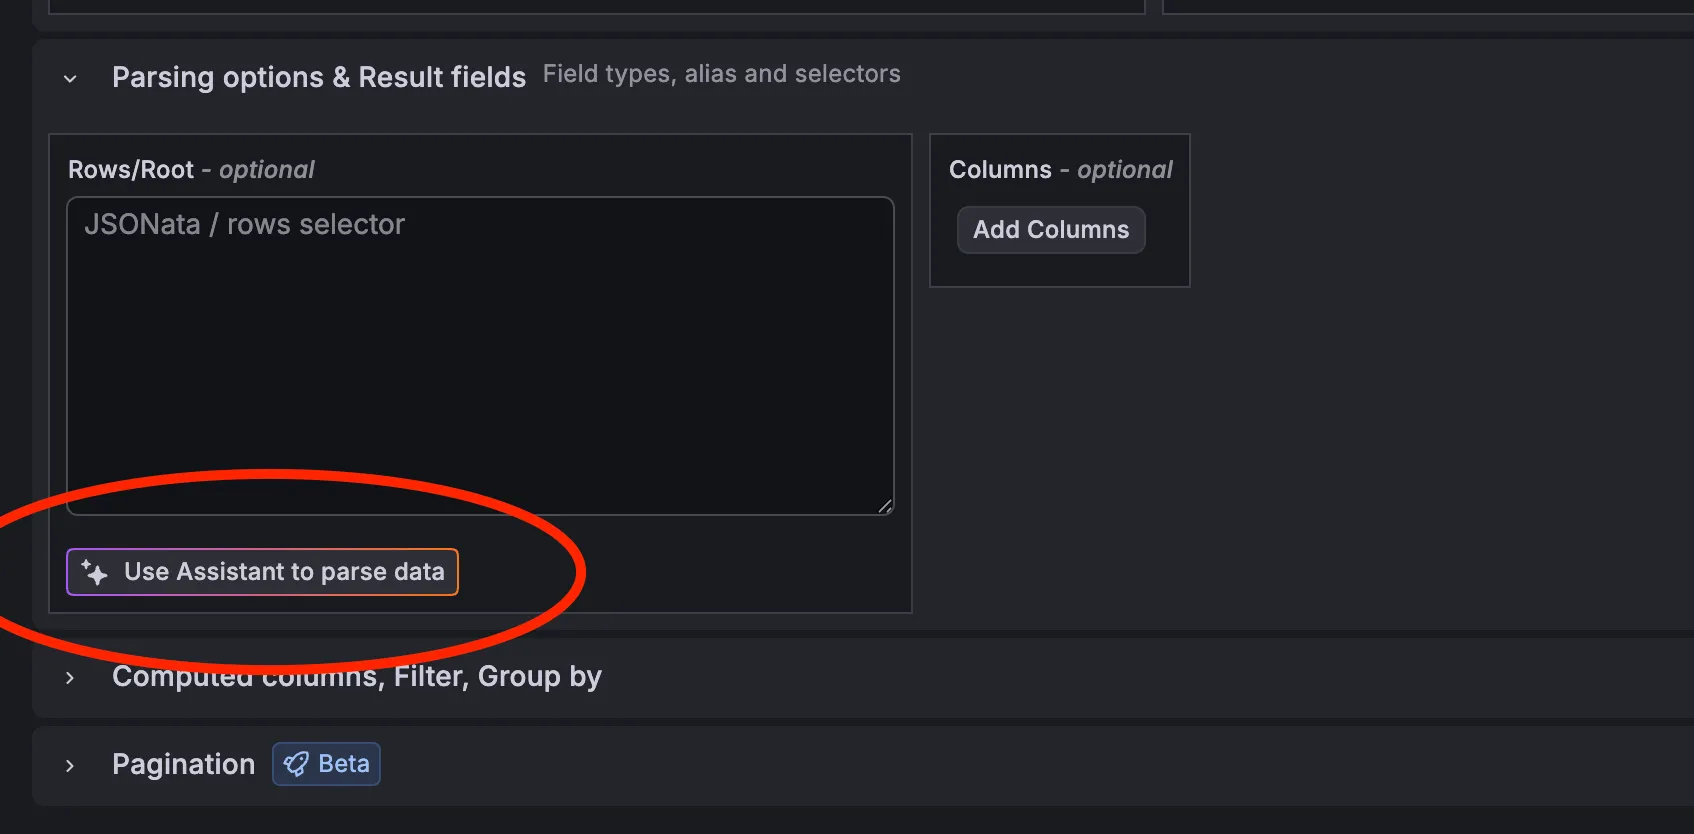
Infinity supports multiple parsing options. You can absolutely use that to turn the Cloudflare response into a clean table.
I personally like using JSONata here because it is a bit more powerful and flexible inside Grafana.
To extract only the SQL result rows, use this parser expression:
$.result.resultsThat is often enough to get a nice table directly in Explore.
You can also ask the Grafana AI assistant to help shape the query result, but there is one caveat: when it regenerates the query, it may drop your custom headers. If your query suddenly stops working, double-check the authentication headers first.
Another practical option is to configure the parser and request settings directly at the datasource level so every query starts from a safer default.
Important security warning#
Do not keep sensitive Cloudflare auth tokens in per-query HTTP headers if you can avoid it.
It is much better to set the token at the datasource configuration level so it is less likely to leak through shared queries, logs, screenshots, or debugging sessions.
My recommended global datasource setup for Cloudflare is:
- allowed hosts:
https://api.cloudflare.com - bearer token configured in the datasource authentication section
Then your actual panel queries only need to provide the endpoint path and JSON body.
Build a simple stat panel#
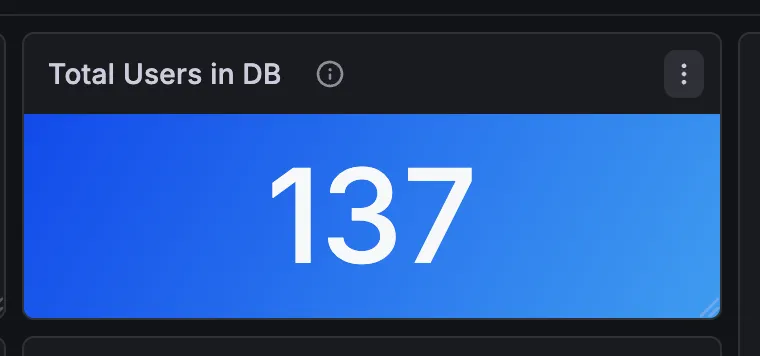
For a quick dashboard example, let’s display the number of users.
Use this request body:
{
  "sql": "SELECT COUNT(id) FROM users"
}
Then choose a Stat panel in Grafana.
That gives you a very simple big-number widget backed by live D1 data.
What about large result sets?#
If you expect bigger responses, Cloudflare also exposes another endpoint:
https://developers.cloudflare.com/api/resources/d1/subresources/database/methods/raw
The /raw endpoint returns rows as arrays instead of objects and is documented by Cloudflare as a more performance-oriented alternative to /query.
For small dashboards and exploratory work, /query is usually more pleasant because the returned JSON is easier to work with. But if volume grows, /raw is worth testing.
Final thoughts#
I really like this setup because it is simple and fast:
- no custom API layer
- no dedicated exporter
- no need to move the data elsewhere just to graph it
Just Grafana, Infinity, and the Cloudflare D1 HTTP API.
If you only need a couple of dashboards on top of D1, this is probably the fastest path to value.